Next: Protocol, Previous: Installation, Up: Top [Contents]
The following is the content of gauss_mean_est_R.pl.
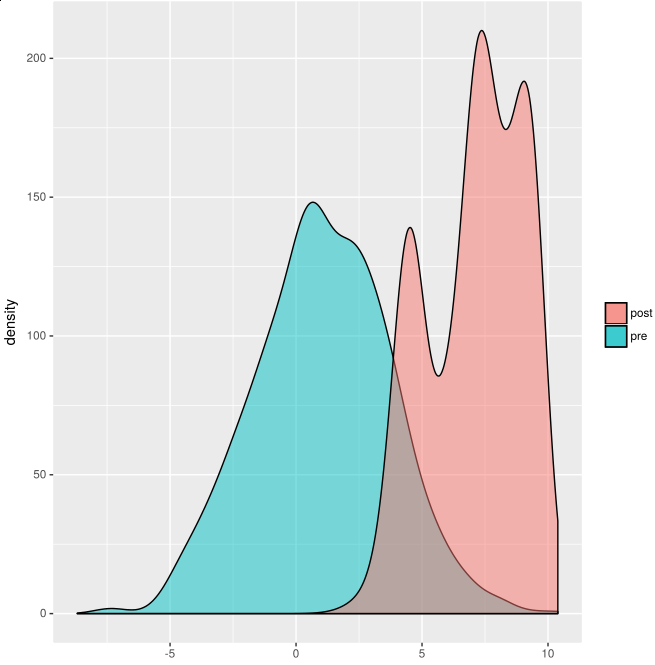
/*
Posterior estimation in Bayesian models.
We are trying to estimate the true value of a Gaussian distributed random
variable, given some observed data. The variance is known (2) and we
suppose that the mean has a Gaussian distribution with mean 1 and variance
5. We take different measurement (e.g. at different times), indexed
with an integer.
Given that we observe 9 and 8 at indexes 1 and 2, how does the distribution
of the random variable (value at index 0) changes with respect to the case of
no observations?
From
http://www.robots.ox.ac.uk/~fwood/anglican/examples/viewer/?worksheet=gaussian-posteriors
*/
:- use_module(library(mcintyre)).
:- use_module(library(cplint_r)).

:- mc.
:- begin_lpad.

value(I,X) :-
  mean(M),
  value(I,M,X).
% at time I we see X sampled from a Gaussian with mean M and variamce 2.0

mean(M): gaussian(M,1.0, 5.0).
% Gaussian distribution of the mean of the Gaussian of the variable

value(_,M,X): gaussian(X,M, 2.0).
% Gaussian distribution of the variable


:- end_lpad.

hist_uncond(Samples,NBins):-
  mc_sample_arg(value(0,X),Samples,X,L0),
  histogram_r(L0,NBins).
% plot an histogram of the density of the random variable before any
% observations by taking Samples samples and by dividing the domain
% in NBins bins

dens_lw(Samples):-
  mc_sample_arg(value(0,Y),Samples,Y,L0),
  mc_lw_sample_arg(value(0,X),(value(1,9),value(2,8)),Samples,X,L),
  densities_r(L0,L).
% plot the densities of the random variable before and after
% observing 9 and 8 by taking Samples samples.


/** <examples>
?- dens_lw(1000).
% plot the densities of the random variable before and after
% observing 9 and 8
?- hist_uncond(10000,40).
% plot an histogram of the density of the random variable before any
% observations
?-  mc_lw_expectation(value(0,X),(value(1,9),value(2,8)),1000,X,E).
% E = 7.166960047178755
?- mc_expectation(value(0,X),10000,X,E).
% E = 0.9698875384639362.

*/
Using ?- dens_lw(1000) as query the following chart is produced:
For other examples see all the files ending in "_R.pl" on https://github.com/friguzzi/swish/tree/master/examples/inference
Next: Protocol, Previous: Installation, Up: Top [Contents]